
Dashboard Samples
Any KPI or information you need displaying — we can create a visual for you
Our dashboard samples show how Support Logix transforms raw business data into clear, actionable insights. Every organisation has key metrics that matter—sales performance, financial health, operational efficiency, customer behaviour—and dashboards make these metrics visible in a way that supports confident decision‑making.
The examples on this page highlight the style, clarity, and structure we bring to every project, whether you need high‑level executive reporting or detailed operational analysis. Dashboards are designed to reduce manual reporting, eliminate spreadsheet errors, and give your team real‑time visibility of what’s happening in the business.
We build each solution in Power BI using clean data models, automated refreshes, and intuitive layouts that make complex information easy to understand. These samples represent only a small portion of what’s possible; every dashboard we create is tailored to the unique needs of your organisation.
If you’d like to explore how a custom dashboard could improve your reporting, forecasting, or decision‑making, we’re happy to discuss your requirements and provide guidance on the best approach.
Interactive Dashboard Previews
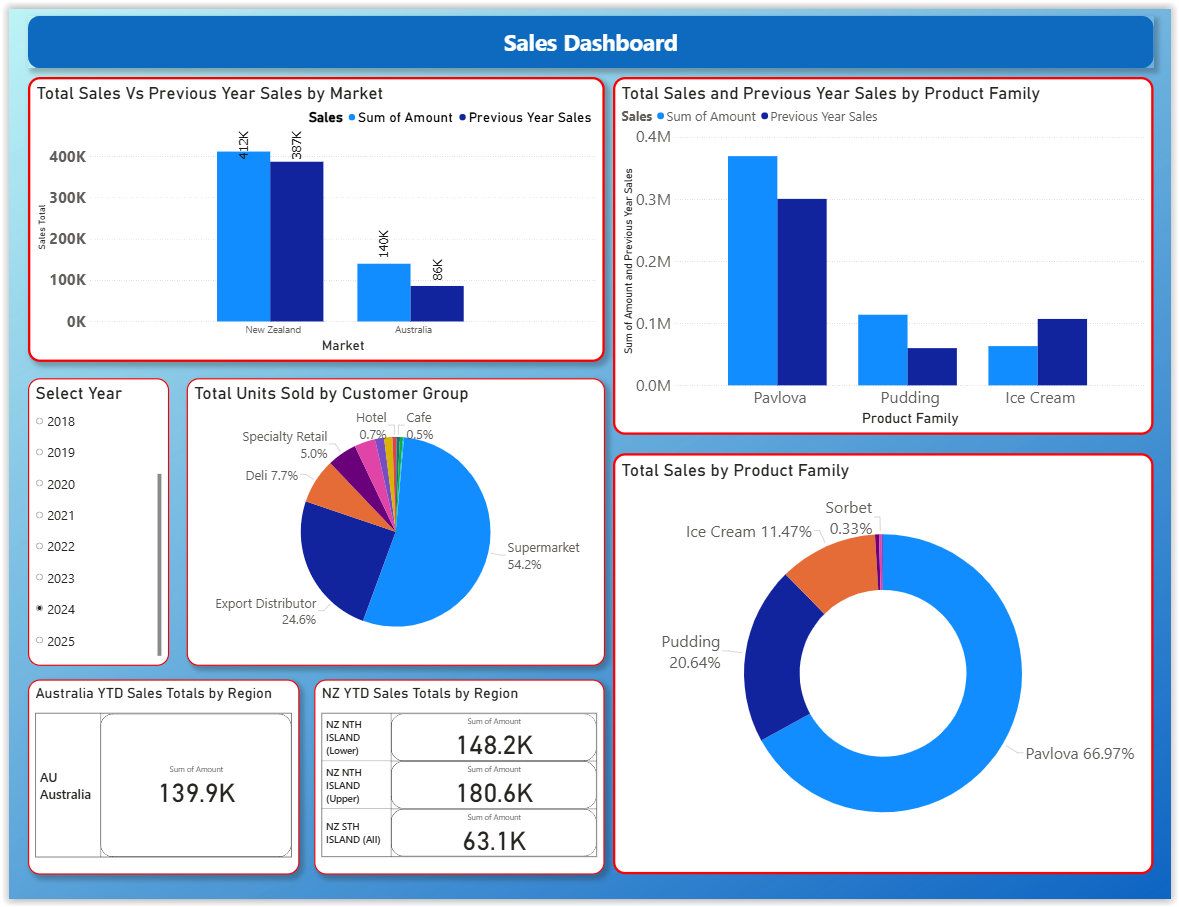
Sales Dashboard
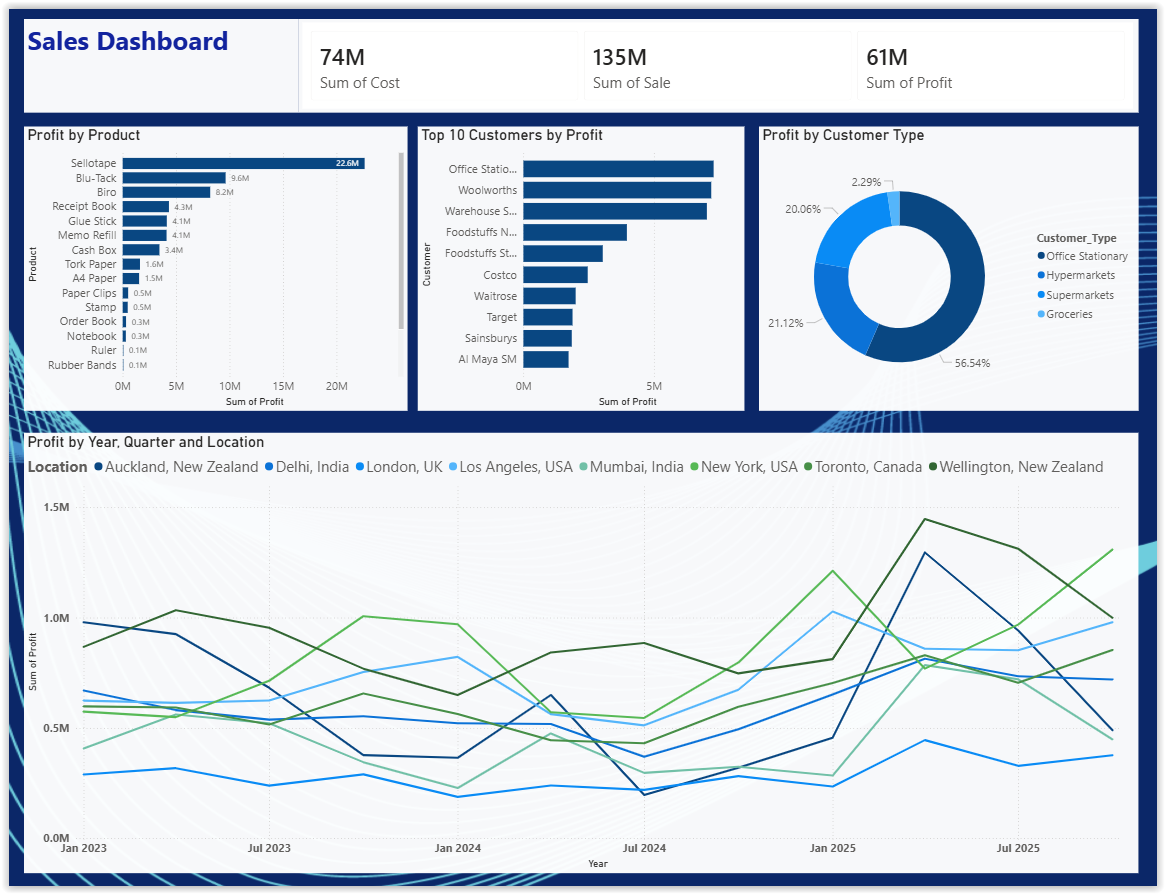
Sales Dashboard (2)
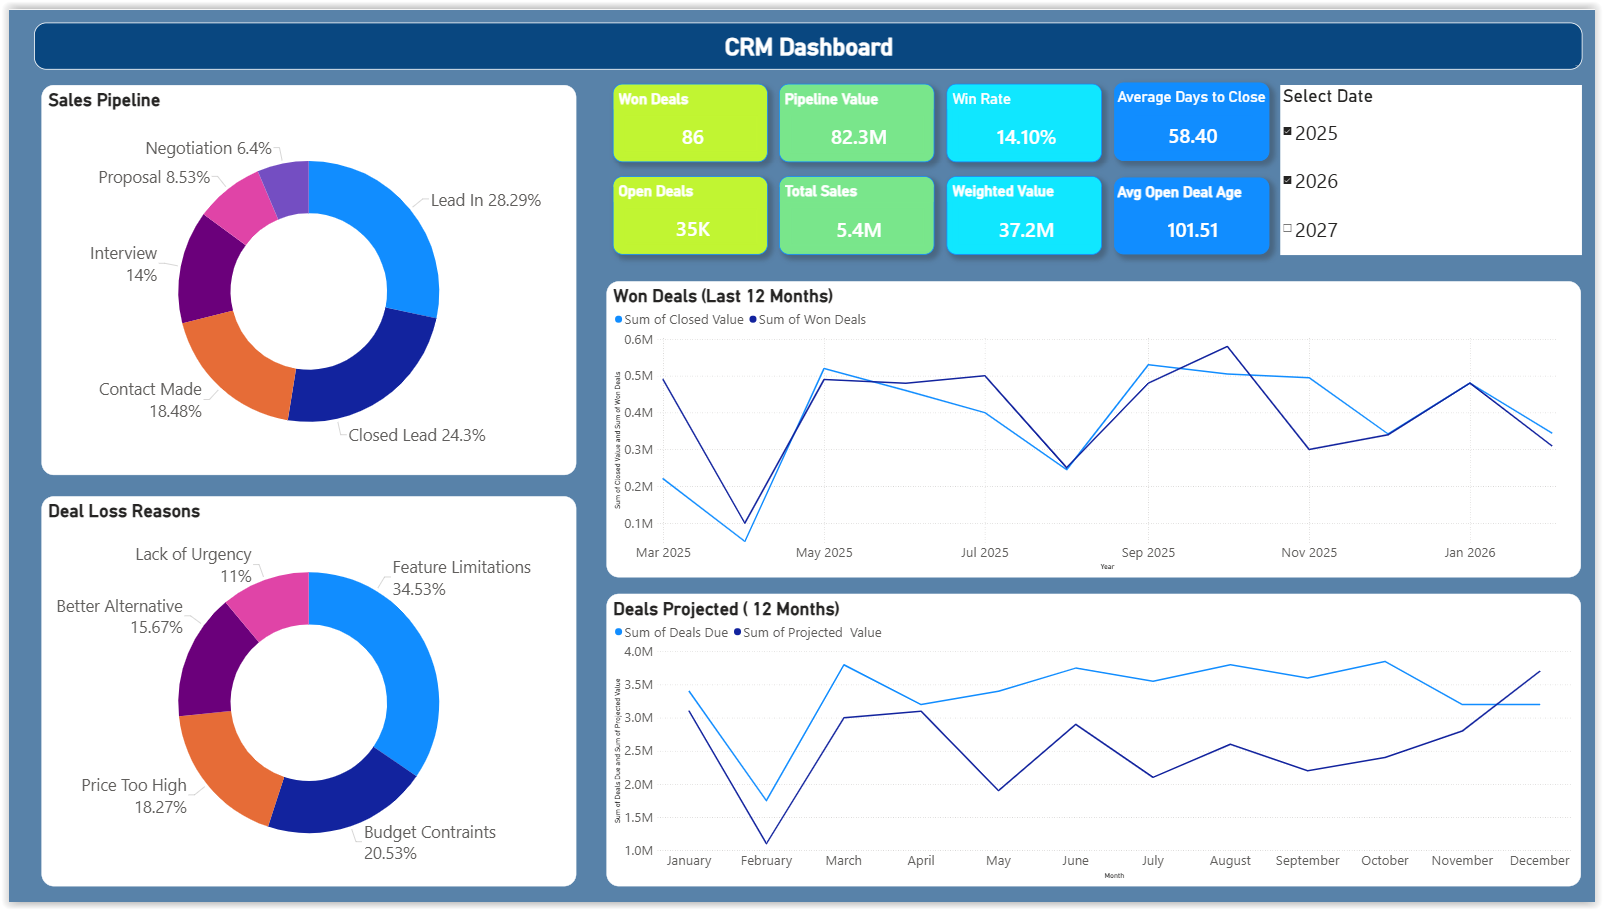
CRM Dashboard
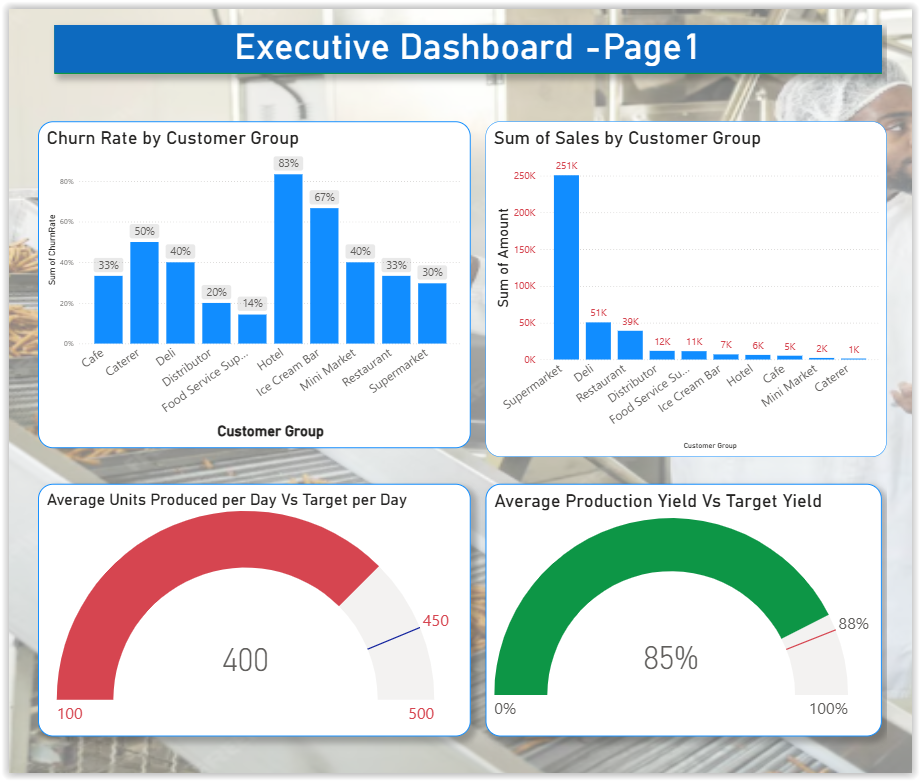
Executive Dashboard
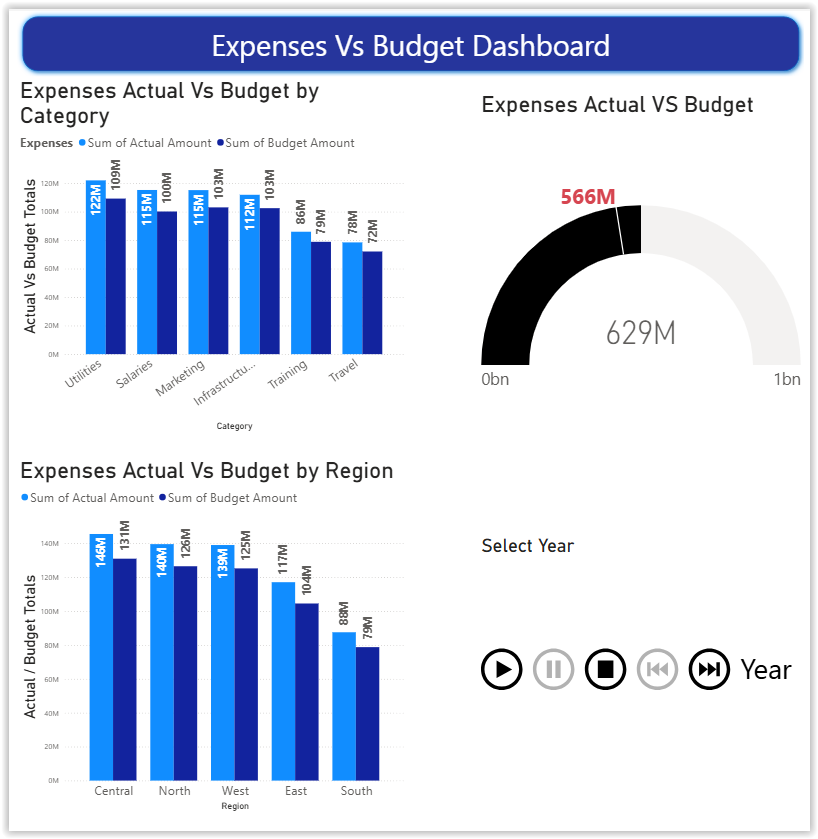
Expenses Dashboard